Feature request: Add an option for Benchmarker to yield every X seconds, i.e. 0.1 or so, during benchmarking. This would allow me to run benchmarks for many minutes while I work on other things. Having it enabled could also add a Cancel button to the “Running benchmark…” screen.
Enable numbers of calls larger than 10k, but only when the yield option is enabled.
It would also give a bit more varied results when the functions being benchmarked include wildcards like Instance.new (which many of your library benchmarks do use, which is kind of a bad practice but whatever), although that’s not always desirable, hence the optionality.
I really want to buy this plugin, but I didn’t before because via robux it was like really expensive and just wasn’t worth it for the shares that Roblox would get, but, now I’ve noticed it moved to a real purchase thing, but now I can’t buy it, because, itch will not use the debit function (and might not be able to do so as I’m not on the USA), and I can’t use credit or use PayPal (as I’m -18), my bank does have an option for buying things with credit but working just like debit, but it won’t work for international purchases, so it doesn’t work either. Do you know like any other method that I could use to purchase Benchmarker? (apart from Robux which isn’t even a thing right now)
Didn’t mention in the patch notes cuz it was minor but the new + button inserts a barebones one, and the beginner template can be accessed from the library for those who need the aid.
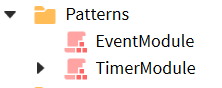
Unsure if this is due to light theme, but the ModuleScript icon displayed is the default one, despite me using Elttob’s Vanilla theme.
ModuleScripts in the explorer are displayed correctly.
I don’t set the image myself, that’s the studio service returning the wrong class icon. Not sure how or why, but if you can find a repro go ahead and file a bug report.
Hello, i have some issue with optimizing script where i got some memories leak, microprofiler is kinda hard to use and i was wondering if this plugin could help to understand and find issue in code easly or is this usefull for other type of problems, Thanks !
 Huge letdown