I’m currently trying to figure out where a memory leak in my game is originating from. I’ve tried disabling all scripts and slowly re-enabling them but I’ve had no luck. This memory leak is so slow and takes such a long time to fill up memory that doing this is basically useless. I’ve looked through every one of my scripts countless times but I’m obviously missing something as I still can’t find where it’s coming from. Roblox gives a very minimal amount of tools when it comes to telling the developer what is taking up memory in the game so I’m stuck. This is obviously very detrimental to the player count as after a while some servers become to laggy and they become unplayable.
The memory used seems to be dependant on something whether that is players joining the game, characters respawning, tools being dropped, etc. as the memory usage varies. For example, a server being up for 12 hours had a memory usage of 3.2gb but another server that had be running for 20 hours only had 2.9gb used.
The 2 things that are using the most memory are “PhysicsParts” and “Instances” seen in the picture below. What does this mean? What contributes to PhysicsParts and Instances? I assume by Instances it means any object in the game but again, I’m not sure.

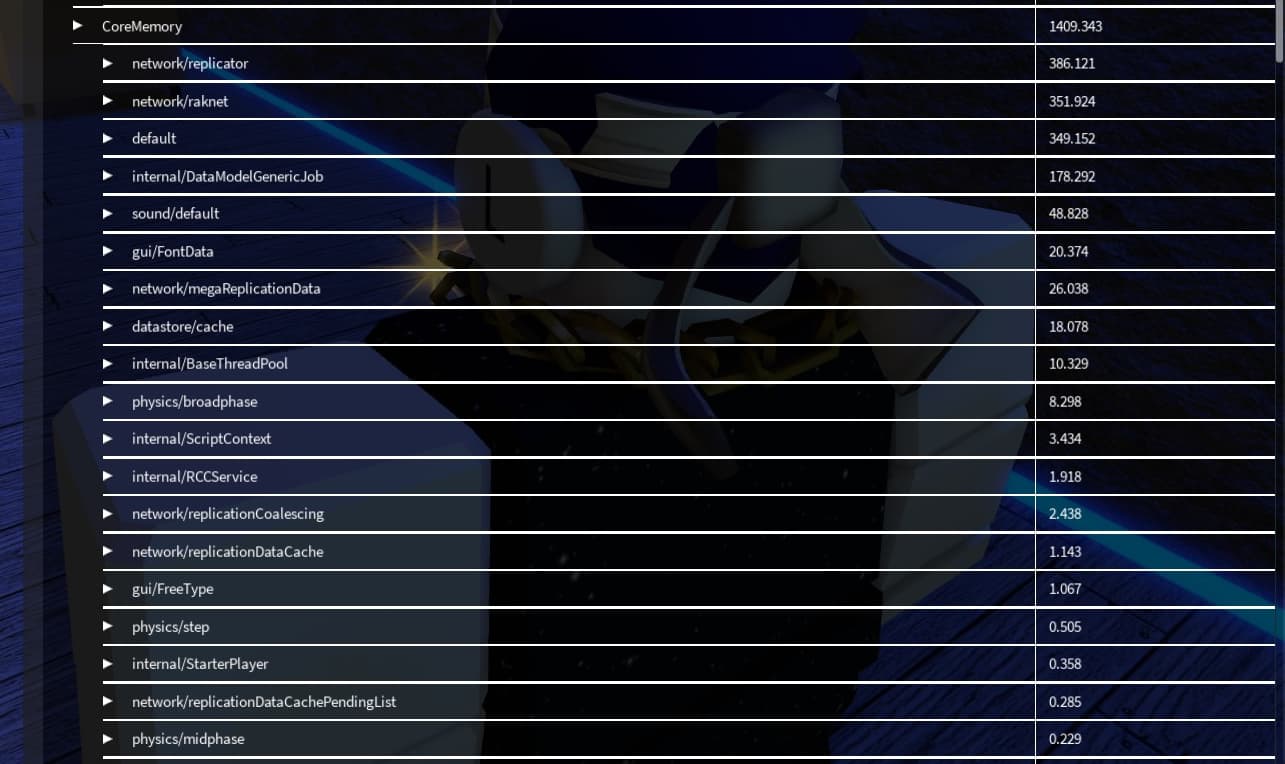
Other things that are using a considerable amount of memory are “network/replicator”, “network/raknet”, “default” and “Internal/DataModelGenericJob” as seen in the picture below. I obviously cannot come up with any idea of what any of those mean and what contributes to it’s memory usage.
With the minimal amount of tools and documentation Roblox provides on preventing and managing memory leaks I’ve had a very hard time tracking down where this memory usage is coming from. If someone could explain to me what all of these things listed above are and what contributes to their memory usage that would be a great help in tracking down this memory leak.