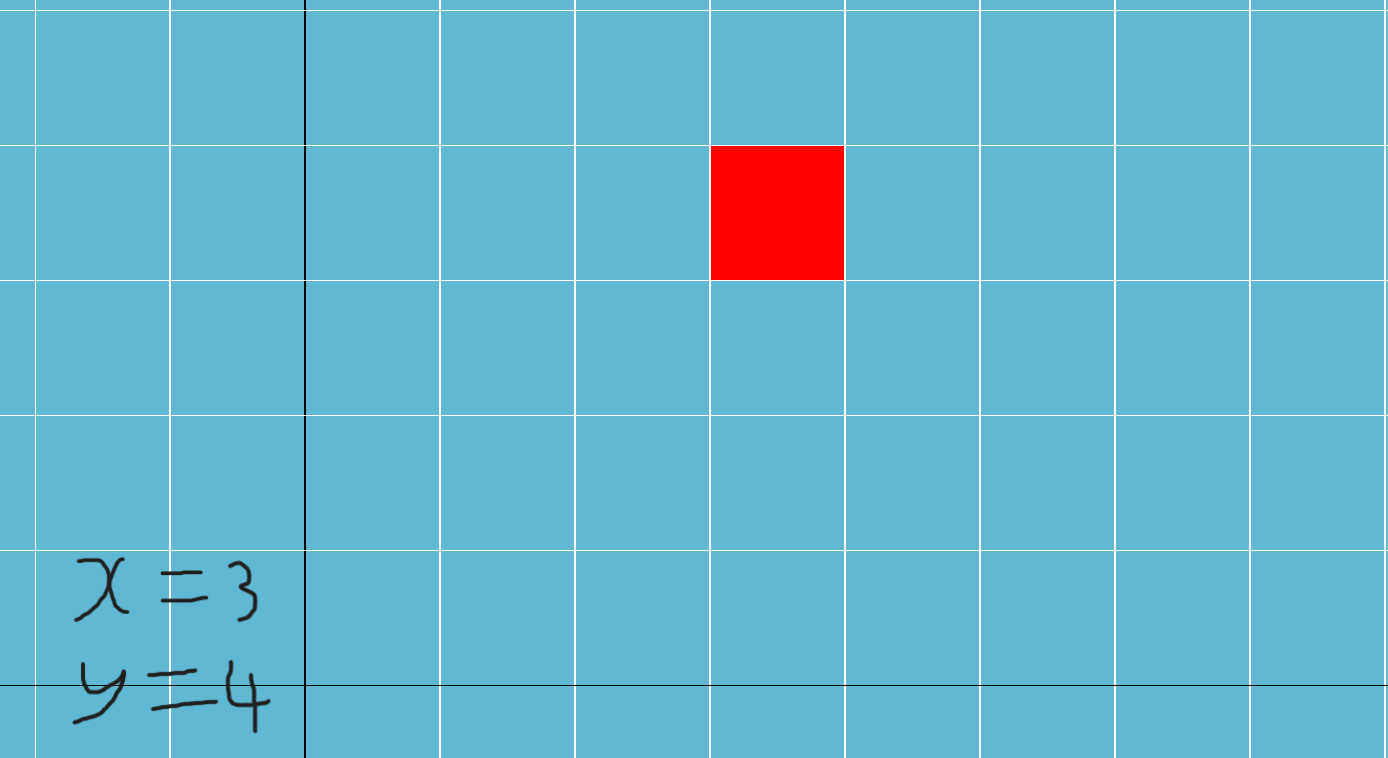
I’ve started making a grid system that creates a dynamic and interactive map for my game, similar to a coordinate plane. The system allows for the generation of grid lines and I’m currently trying to add more functionality to it but I’m not sure how I would go about it. What’ I’m trying to do is make it so where the red square is placed, the text labels automatically update to display the precise X and Y coordinates of its location on the grid, reflecting any movement or changes in real-time. How can I accurately track and display the square’s position as it interacts with the grid?
local SG = Instance.new("ScreenGui", game.Players.LocalPlayer.PlayerGui)
local mouse = game.Players.LocalPlayer:GetMouse()
local up = true
local PrevSquare
CamPos = Vector2.new(0, 0)
local Lines = {}
SG.IgnoreGuiInset = true
local Background = Instance.new("Frame", SG)
Background.BackgroundColor3 = Color3.new(0.380392, 0.721569, 0.827451)
Background.Size = UDim2.new(1, 0, 1, 0)
local gridSpacing = 50
local CoordFrame = Instance.new("Frame", SG)
CoordFrame.AnchorPoint = Vector2.new(0, 1)
CoordFrame.Position = UDim2.new(0, 0, 1, 0)
CoordFrame.BackgroundTransparency = 1
CoordFrame.Size = UDim2.new(0.1, 0, 0.1, 0)
local XCoord = Instance.new("TextLabel", CoordFrame)
local YCoord = Instance.new("TextLabel", CoordFrame)
XCoord.BackgroundTransparency = 1
YCoord.BackgroundTransparency = 1
Spacing = 200
XCoord.TextScaled = true
YCoord.TextScaled = true
XCoord.Size = UDim2.new(1, 0, .5, 0)
YCoord.Position = UDim2.new(0, 0, 0.5, 0)
YCoord.Size = UDim2.new(1, 0, .5, 0)
local function CreateGridLine(ScreenPos, Axis)
	local Line = Instance.new("Frame", Background)
	Line.BackgroundColor3 = Color3.new(1, 1, 1)
	Line.BorderSizePixel = 0
	if Axis then -- If Axis is true, create a horizontal line, otherwise make a vertical line
		Line.Size = UDim2.new(0, 1, 1, 0)
		Line.Position = UDim2.new(ScreenPos, 0, 0, 0)
	else
		Line.Size = UDim2.new(1, 0, 0, 1)
		Line.Position = UDim2.new(0, 0, ScreenPos, 0)
	end
	Lines[#Lines + 1] = Line
	return Line
end
local function CreateSquare(PosX, PosY)
	local square = Instance.new("Frame", Background)
	square.BackgroundColor3 = Color3.new(1, 0, 0)
	square.Size = UDim2.new(0, Spacing, 0, Spacing)
	square.Position = UDim2.new(PosX, 0, PosY,0)
	square.BorderSizePixel = 0
	return square
end
local function CreateGrid(VPS, Space, CameraPos)
	local MidLineXPos
	local MidLineYPos
	local numVerticalLines = VPS.X / Space + 1
	local numHorizontalLines = VPS.Y / Space + 1
	local startVerticalLine = (CameraPos.X % Space) - Space
	local startHorizontalLine = (CameraPos.Y % Space) - Space
	local EndVerticalLineSize = VPS.X - (math.floor(numVerticalLines)*Space + startVerticalLine)
	local EndHorizontalLineSize = VPS.Y - (math.floor(numHorizontalLines)*Space + startHorizontalLine)
	if Space + startVerticalLine > Space + EndVerticalLineSize then
		MidLineXPos = (math.floor(numVerticalLines/2 - 0.5)*Spacing + startVerticalLine)/VPS.X
	else
		MidLineXPos = (math.floor((numVerticalLines+ 1)/2 - 0.5)*Spacing + startVerticalLine)/VPS.X
	end
	if Spacing + startHorizontalLine > Space + EndVerticalLineSize then
		MidLineYPos = (math.floor(numHorizontalLines/2 - 0.5)*Spacing + startHorizontalLine)/VPS.Y
	else
		MidLineYPos = (math.floor((numHorizontalLines+ 1)/2 - 0.5)*Spacing + startHorizontalLine)/VPS.Y
	end
	local gridX = math.floor(MidLineXPos * VPS.X / Space)
	local gridY = math.floor(MidLineYPos * VPS.Y / Space)
	PrevSquare = CreateSquare(MidLineXPos, MidLineYPos)
	for i = 1, math.floor(VPS.X / Space + 0.5) + 1 do
		local linePosition = (startVerticalLine + i * Space)
		local l = CreateGridLine(linePosition / VPS.X, true)
		if math.floor(VPS.X*(CameraPos/VPS).X + 0.5) == linePosition then
			l.BackgroundColor3 = Color3.new()
		end
	end
	for i = 1, math.floor(VPS.Y / Space + 0.5) + 1 do
		local linePosition = (startHorizontalLine + i * Space)
		local l = CreateGridLine(linePosition / VPS.Y, false)
		if math.floor(VPS.Y*(CameraPos/VPS).Y + 0.5) == linePosition then
			l.BackgroundColor3 = Color3.new()
		end
	end
end


mouse.WheelForward:Connect(function()
	for x = 1, 20 do
		local inc = 3/x
		task.wait()
		Spacing += math.floor(inc)
	end
end)
mouse.WheelBackward:Connect(function()
	for x = 1, 20 do
		local inc = 3/x
		task.wait()
		Spacing -= math.floor(inc)
	end
end)
mouse.Button1Down:Connect(function()
	up = false
	local Original = Vector2.new(mouse.X, mouse.Y)
	local OGCamPos = CamPos
	repeat
		local Offset = Vector2.new(mouse.X, mouse.Y) - Original
		CamPos = OGCamPos + Offset
		task.wait()

	until up
end)
mouse.Button1Up:Connect(function()
	up = true
end)
while true do
	for _, v in ipairs(Lines) do
		v:Destroy()
	end
	Lines = {}
	Spacing = math.clamp(Spacing, 2, 300)
	local ViewPortSize = workspace.CurrentCamera.ViewportSize
	XCoord.Text = "X = " .. ""
	YCoord.Text = "Y = " .. ""
	CreateGrid(ViewPortSize, Spacing, CamPos)
	task.wait()
	PrevSquare:Destroy()
end