Bug: Microprofiler is hiding the boxes representing cpu time
Steps to Reproduce
- Enter experience that you own
- Press Settings > Developer Console
- Switch to MicroProfiler Tab and press Client
- Leave Default of 2 Frames per Second and 2 Seconds to Record
- Press Start Recording button, wait for recording to finish
- Notice an html report file is referenced
- Open the generated html report file in your web browser
- Notice when panning and zooming, you can see little colored boxes representing the scripts running
- Notice when you are not panning and zooming, the colored boxes disappear
- Notice you can hover your mouse over the invisible boxes, and still see the tooltip
Expected
I need to be able to see the colored boxes
Observed
There is a bug that is hiding the colored boxes unless Pan or Zoom is active.
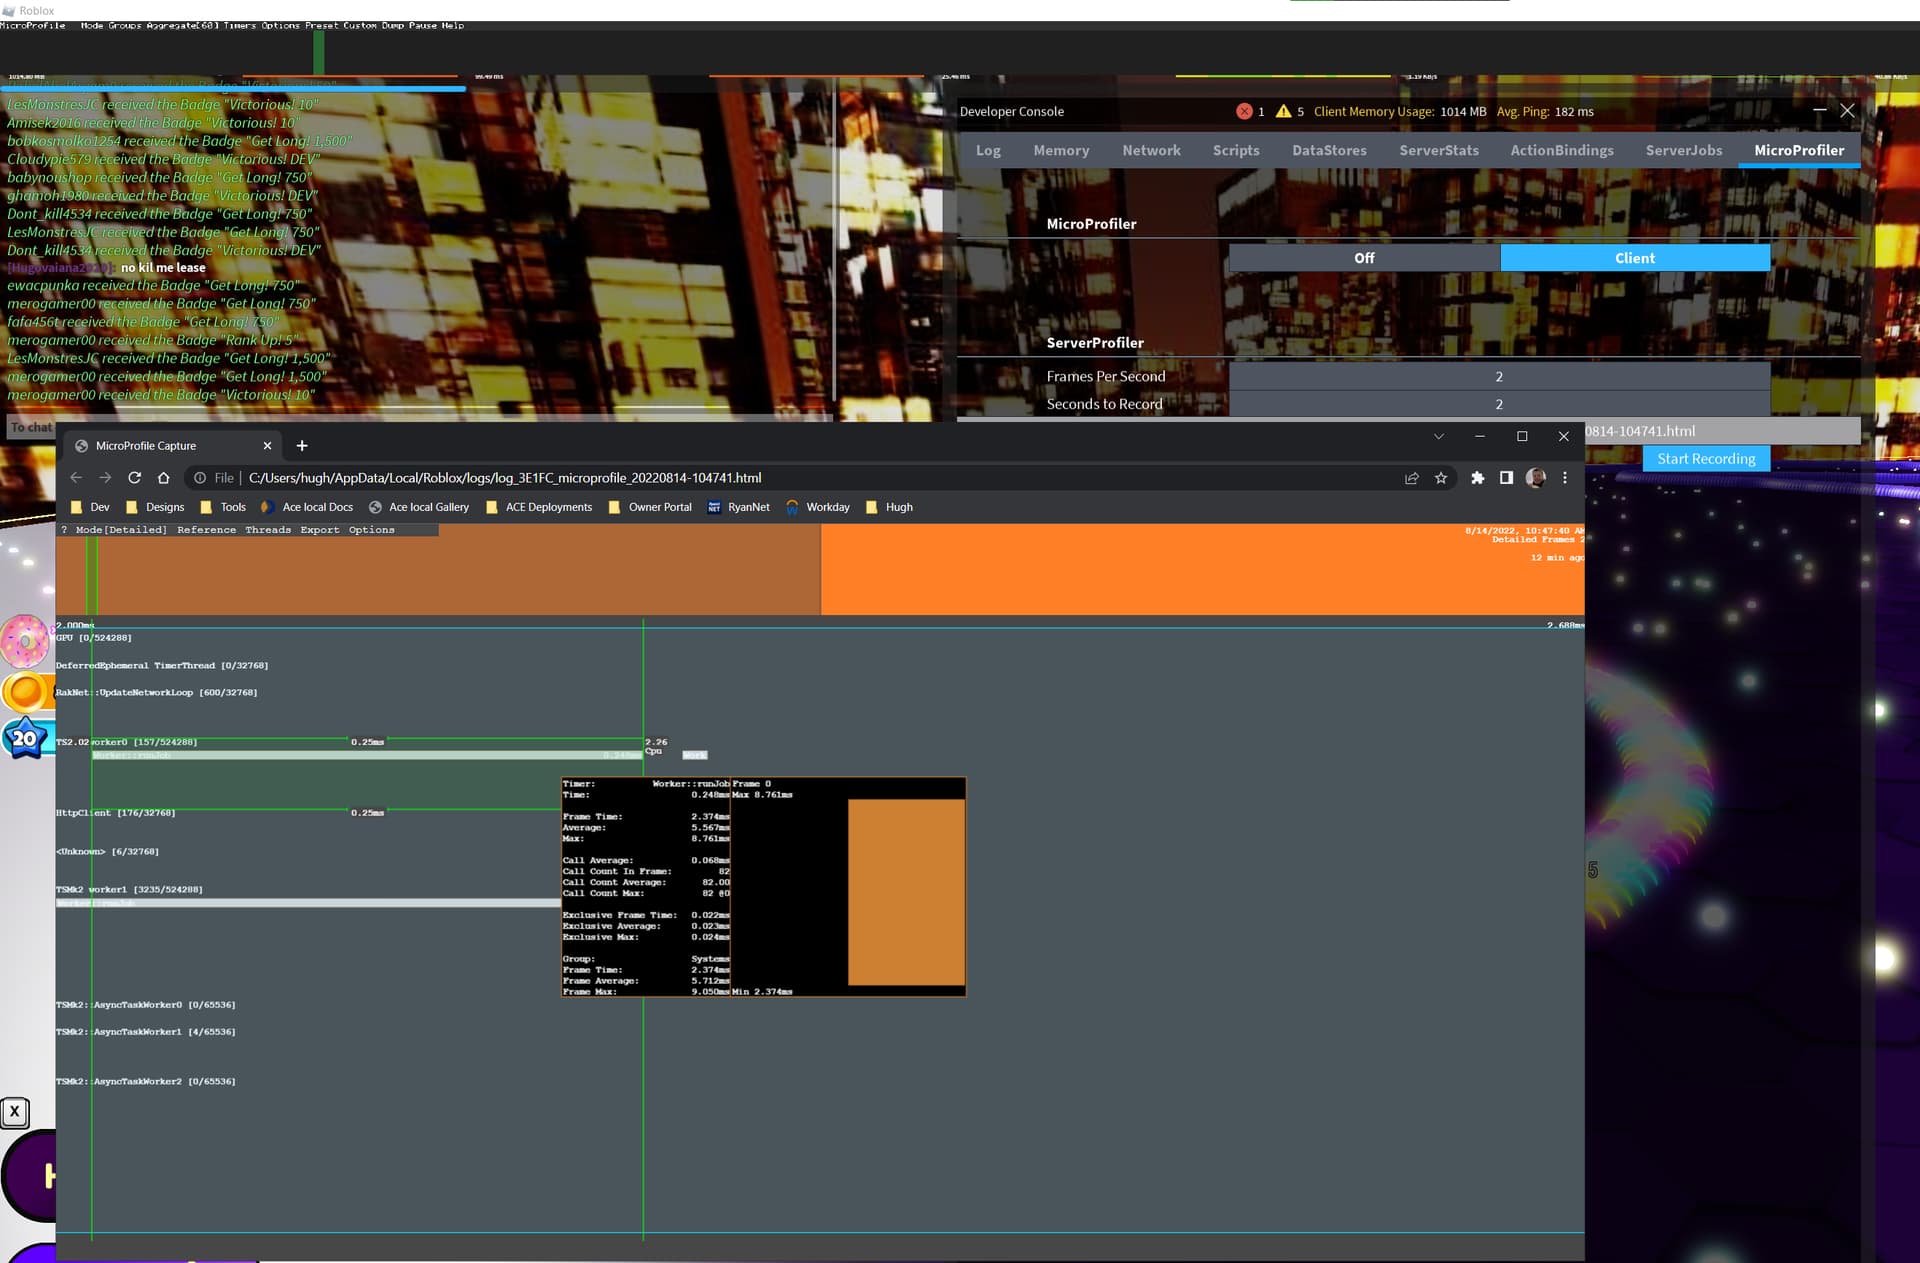
Screen Shot
Showing the generated report, hovering over an invisible box and getting the tooltip.
You can also resize your web browser window and briefly you’ll be able to see the colored boxes. I managed to grab this 2nd screen shot while I was resizing the web browser, and you can now briefly see the colored boxes

Video
https://www.awesomescreenshot.com/video/10767456?key=cd5531181bae8774b7110591ba6377c2
Browser
This appears to be isolated to Chrome web browser. As @Focia19 did not repro it on Firefox, Brave, Edge or Opera browsers.