I think my game is also impacted by this issue. Although I’m not fully able to confirm that this is a network/raknet issue, I know that following the recent Performance tab upgrade to creator dashboard, I was able to assess that suddenly during some of the testing sessions on my game, the server memory suddenly jumps to 6.25 gigs before crashing. All of this is unexpected, there is no particular action performed by the players, it doesn’t seem to happen during a specific event (like, map loading), and I remember taking note for myself in the past that raknet memory was unusually high at some point in live game.
I’m glad to see that our issues with high server memory are finally being addressed, especially when it doesn’t feel like it’s anything in our scope, but I also feel like the hard capped 6.25 gigs is very limiting, especially as games are getting more complex with more maps trying to fully utilize the full capabilities of PBR textures & Future is Bright, every single textures/parts/meshes being cached and never fully freed means that there is a very high memory usage despite only one map being loaded at a time.
Roblox should start to consider increasing that memory cap or periodically partially freeing cached instances (which are, by the way, categorized as UntrackedMemory, making it more difficult for us to find the difference between memory leaks or regular engine caching). I personally feel like my project will soon reach the server limits in term of assets, and that I won’t be able to add any more maps.
For some extra information, we’ve observed that the raknet memory is directly correlated to an unexplained increase in PhysicsParts, Signals, and other place memory statistics, particularly when players join. We don’t create any instances other than the standard character model for player joins, and the raknet increase occurs around the same time.
Unfortunately I’m unable to narrow it further, as the increase is only properly identifiable (rather than just incremental) when many players join at the same time (i.e. when a new server starts, or an old server closes with their players mass migrating to a new server). This makes me think there is some overhead from character models when someone spawns which should be removed from memory but aren’t for whatever reason and are being replicated.
As a side pointer our game makes heavy use of HumanoidDescription; I’m unsure if this is correlated and somewhat doubtful as trying successive respawns on already joined players doesn’t seem to have an abnormal increase in memory as opposed to players join.
Since in the code I had an artificial delay in processing requests, the memory accumulated weaker, I removed this delay and now all requests are sent instantly, because of which the servers began to crash even more.
3 GB in 4 hours of runtime with 110 players is definitely something new.
I can’t say for sure why UntrakedMemory rises so much, maybe it’s a mistake in my code, or maybe a mistake in the Roblox code, but most likely I use all the functions correctly, they are just used very often and quickly, due to the large number of players.
Hopefully PlumJar’s investigation will figure out what’s wrong.
Hey @PozziDev, thanks for sharing. Can you please elaborate on this artificial delay when processing requests? Are these requests RemoteEvents or RemoteFunctions initiated on the Client and answered on the server? What kind of delay did you introduce? Any other details you can share about the kind of work that is being done (processing)?
I have a custom FireClients() function that sends FireClient() to all clients listed in the table. It looks something like this
function FireClients(clients, event, ...)
   for _, client in pairs(clients) do
      event:FireClient(client, ...)
   end
end
I did this because I needed to send the request only to certain players, and not to all, as FireAllClients() does. I can assume that frequent use of FireClient() in a loop may leak UntrackedMemory and network/raknet. Due to the peculiarities inside the FireClient() function, it is possible that some variables are initialized in it and are not cleared properly, this is inside the engine and I cannot be sure, it turns out that the engine has to initialize internal variables again and again for the FireClient() function to work while it is called in a loop like for.
The artificial delay is the wait() function in the for loop. It looks something like this
function FireClients(clients, event, ...)
   for _, client in pairs(clients) do
      event:FireClient(client, ...)
      wait() -- artificial delay
   end
end
When the delay works, it causes UntrackedMemory to grow more slowly, and server runtime goes up. I can’t say exactly how much artificial delay effectively stops this problem, but there is clearly a difference, and it depends on the delay.
Perhaps this can be solved with an engine function such as FireCertainClients() for RemoteEvent and RemoteFunction, as is done in TeleportService, but most likely I need to create a post in the feature suggestions section for this. In this case, it seems to me that the problem is related to FireClient() and the frequent call.
I also want to draw your attention to the fact that the memory does not increase gradually, but at a certain moment and a lot, this is also accompanied by a 5 second server freeze. It was hard for me to catch it, but here is the stats of the moment
On the graph is total server memory, UntrackedMemory was 600 MB less (4400 MB)
Has there been any update regarding this? My game crashes quite often; although it is our fault development-wise (let me know of any tips please!), this certainly plays a factor.
Today we enabled 3 patches related to memory leaks that would be captured by the ‘memory/raknet’ scope. I can’t guarantee they will solve the issues you guys have reported, so please report back if you’re still seeing the growing memory usage.
We are also working on a better system for capturing memory usage which should make this process easier in the future.
Thank you for the quick response. I will let you know in the coming days if this improves on our end. It may be a bit as I want to ensure I report issues related to network/raknet and not other memory problems that may be caused by our end (unless you want that reported as well)
Also, I look forward to seeing the new memory-capturing system! Thank you for letting us know
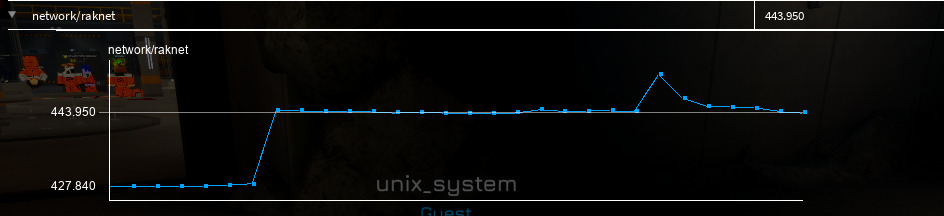
Here’s our current raknet usage - it’s looking a lot more stable (although still generally high). Not seeing the big curve that we used to. I’ll set up our logging again to get an idea as to server lifetimes
Thank you again for the engagement here and for pushing out a fix so rapidly. I know how challenging these things are to diagnose and our playerbase absolutely appreciates it just like we do!
edit: Update - I’m still seeing some fairly large growth - I think it’s correlated to number of users in game, but don’t have any hard proof on that.
Of course! Thank YOU guys for reporting. Yeah memory leaks are no fun to find, but super important to solve.
Glad you might be seeing some improvements. It sounds like there might still be some work to do though, so I’m going to keep an eye on this thread~ hopefully more devs report back. If you guys are still experiencing the problem, I will of course continue the investigation.
just as it seems to me, it began to grow more slowly
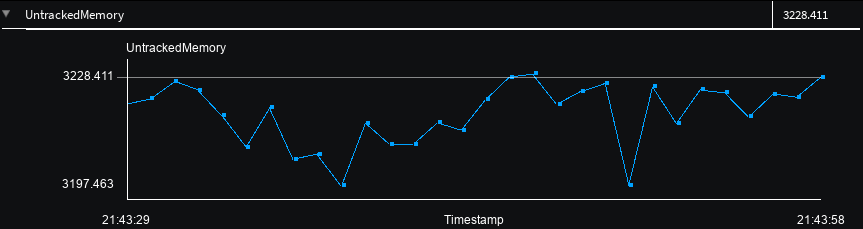
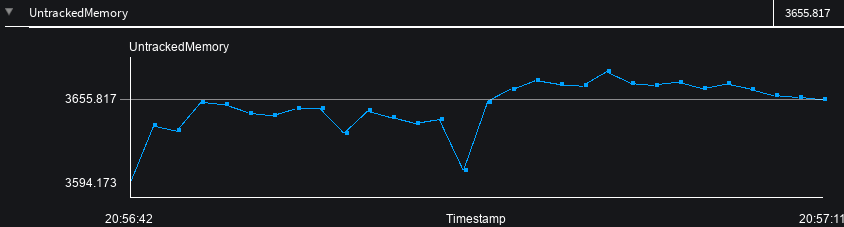
Also, tell me, are there any problems with UntrackedMemory? Is this growing insanely fast, is it related to raknet, or do I need to create a separate post about UntrackedMemory? Here’s what I got in 5 hours. Could this be a problem on my side?
Hey PozziDev, thanks for checking. I’m glad it looks like a sizeable improvement compared to some of your previous reports. We’re going to continue working on improvements until the problem is fully mitigated.
As for the UntrackedMemory, this would be a separate issue. I believe there is a recent post which some other engineers (who work more closely in that area than I) are paying attention to. Please feel free to contribute there (or make another post if you feel your experience is different enough).
I would also suggest poking around some other posts in case there are solutions related to lua scripting while we work on a better system for diagnosing and repairing these types of prolems.
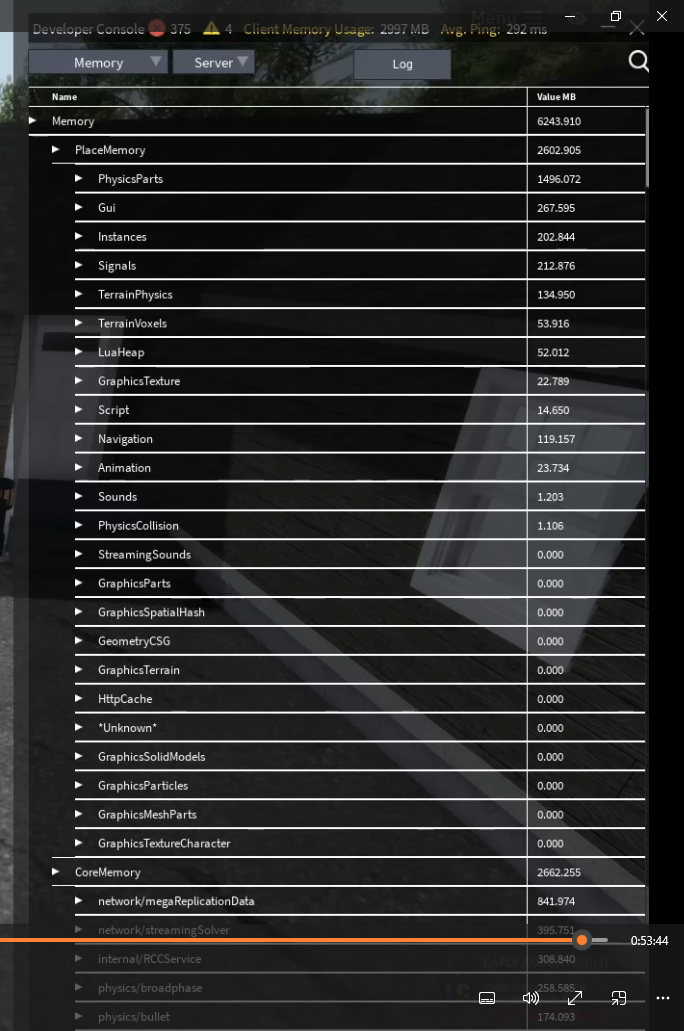
The perpetrators are exactly the same as 6 months ago. Nothing has changed.
network/Raknet.
network/replicationcoalescing
network/sharedQueue
UntrackedMemory.
All the others within CoreMemory are pretty stable, regardless of playercount & age of server. PlaceMemory is irrelevant & so seems PlaceScriptMemory to be.
It’s now been going on for more than 6 months, with no clear end in sight.
What’s the status on this getting resolved? Is it even a priority anymore?
It’s very discouraging as a developer, having our servers crash every 1-2 hours of heavy usage, without being able to fix it, as it’s out of our hands to change.
Our game relies heavily on long play-sessions, as it takes hours to grow & survive your dinosaurs. But servers crashing constantly, interrupts out gameplay-loop intensely. We’re severely limited at this point & cannot do anything about it.
Hey Jaco! Thanks for sharing your data. How old was your “Old Server”? We are actively investigating and also investing in the tooling to make this process more efficient. Unfortunately it sounds like our last set of patches did not help your experience, but we are still prioritizing this issue.
When our servers have 10/100 players on them, they last up to 2 days, but only a few hours at 80+/100. As playercount in each server gets higher, the memory leak becomes exponentially worse. That may be why only a few developers are noticing the issue.
I’m also starting to doubt whether or not it is a Roblox issue at all, considering you have published so many patches to attempt to fix it. Even with all our own memory loggers & other tools showing no leaks, could the memory leak not still be of our own creation?
correct me if im wrong but what if you just set the values to nil after using them so it doesnt hold the references to them forever?
function FireClients(clients, event, ...)
   for _, client in pairs(clients) do
      event:FireClient(client, ...)
      task.wait() -- artificial delay
      client=nil
   end
   event,clients=nil,nil
end