Hi Creators,
Today, we are excited to roll out Insights to help you focus on the most important metrics to grow your experience. Starting today, you should see insights along with stats and charts on your new experience overview page.
Personalized insights for your experience
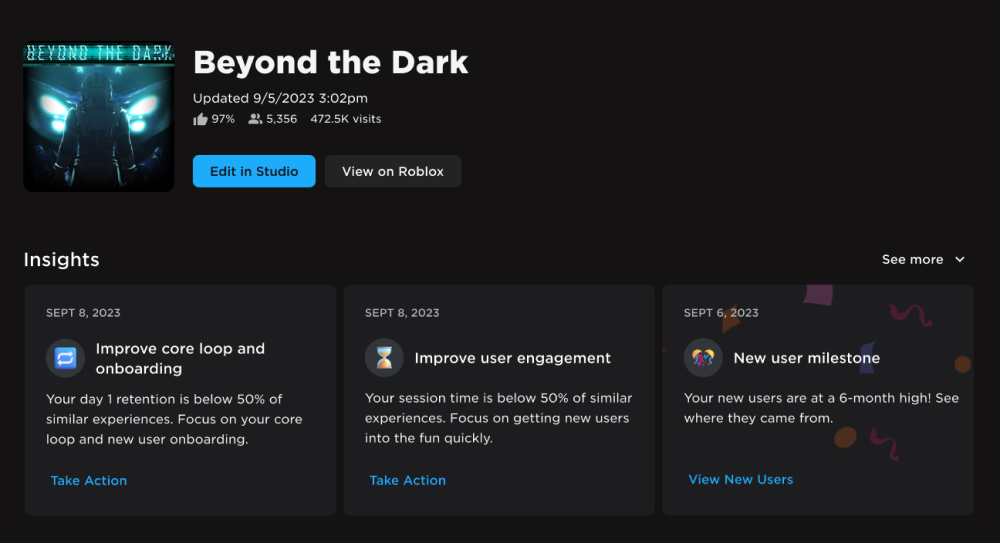
We’ve built three types of insights to help you take actions to grow:
1. Your metric is lower than 50% of similar experiences.
This insight means that a metric is below the 50th percentile of your similar experience benchmarks. Broadly, many experiences need to improve three categories of metrics:
-
Average session time and day 1 retention are key metrics to focus on first because they measure if you’ve built a fun experience that users want to return to. Learn about growing these metrics using our Retention and Engagement guides.
-
Payer conversion rate and ARPPU (average revenue per paying user) measure how much users want to invest in your experience. Learn how to grow these metrics with our Monetization guide.
-
D7 (day 7) and D30 (day 30) retention measure if users are making progress in your experience and returning long-term. Get tips on growing these metrics with our Retention guide.
We’ve recently updated our guides above with videos explaining how to grow each metric. Check them out!
2. Your metric has increased OR decreased by x% week over week.
This insight points to a large percentage change in a metric. Visit the chart for the metric and use your breakdowns (e.g., by platform) to identify what might have led to the change.
3. Your metric is at a 6-month high.
This insight helps you celebrate progress when a metric has reached a 6-month high. Note a metric can be at a 6-month high but still below benchmarks - so keep trying to improve it.
Getting started steps for a new experience

If your experience hasn’t yet reached 100 daily active users, we show the above getting started steps instead of insights due to lack of data. Keep working on your experience to unlock personalized insights.
Top stats and charts to help you monitor your growth

Below the Insights section, you can see stats and the charts for top metrics such as:
- Daily active users
- New users
- Average session time
- Day 1 retention
- Daily revenue
Monitor these stats to understand how your experience is growing. You can also visit the analytics pages for each chart to explore more metrics.
What’s next
We have some exciting updates coming later this year, including better acquisition metrics and analytics for avatar items. We’re also committed to continue to improve insights and would love to hear your feedback in the comments below.
Thanks for working with us to build analytics!
