Hi Creators,
We are excited to announce the Memory Stores observability dashboard today, which allows you to monitor & debug issues with this service in real-time!
Previously, there isn’t much visibility about the performance and issues for your live experiences. It could be challenging to detect, triage, and investigate production issues. To streamline your workflow, we now have a new dashboard that offers insights for Memory Stores in real time with minute level granularity.
The Memory Store observability dashboard has 5 charts:
-
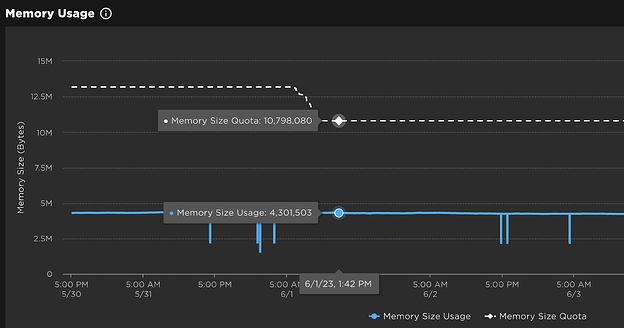
Memory Usage: tracks the memory usage of the experience, and also shows the quota over time.
-
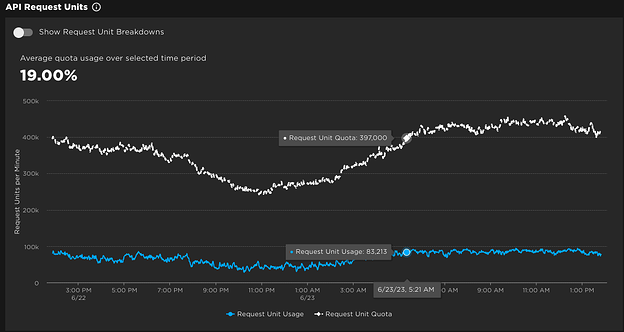
API Request Units: shows the total request units consumed by the experience and the quota. You can also break it down by each API method to identify which uses the most units. Learn more about request units here.
-
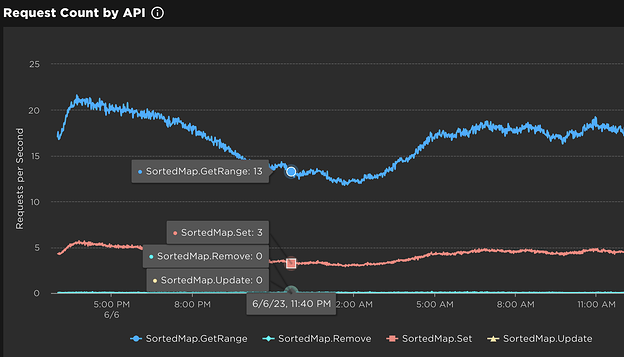
Request Count by API: breaks down the API request count per minute by API method, e.g.
SortedMap:Get()so you can understand which API methods are called the most.
-
Request Count by Status: groups the API requests based on response type, e.g. Success, Invalid Request, etc. You can use this information to identify the top issues for this service.
-
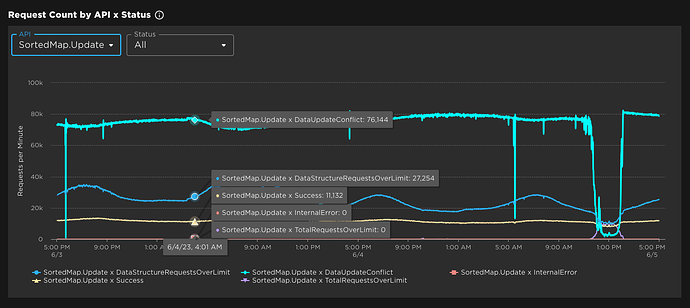
Request Count by API x Status: allows you to analyze the response distribution for a specific API or response type.
We understand that for you to identify the root cause of a particular issue, it’ll probably be useful to know which data structure causes most errors. This will be possible when the Error Reports become available. Stay tuned!
Tips to Handle Limits
Similar to all other services, we recommend building retry logic when API requests are throttled. A good approach is to use exponential backoff. If you are running out of memory, remove the items that are not needed. Generally, we suggest setting the shortest expiration time needed for your items so that your memory can be automatically freed up.
Check out our documentation to learn more. To get started, go to Creator Dashboard, choose the experience you want to monitor, and click the “Memory Stores” section on the left navigation under “Real Time”. We look forward to hearing your feedback and iterating on it! Based on the learnings, we’d love to repeat the pattern for other services in the future.
If you haven’t already, give Memory Stores Service with newly enhanced observability a try. We can’t wait to see what amazing experiences you can build using this fast and reliable in-memory storage!
Cheers for more insights,
The Roblox Creator Services Team


