Please read
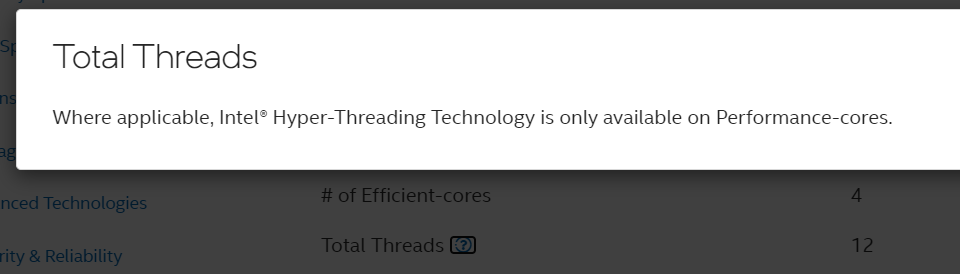
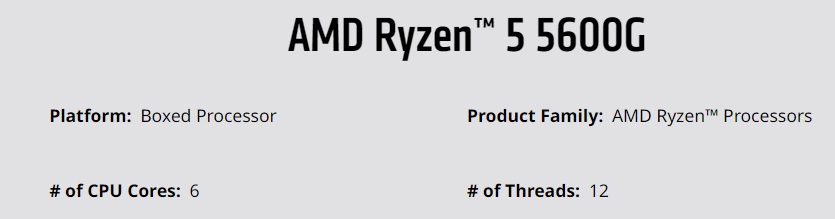
After testing this a bit with the community (and still needs more testing), for now the assumption is that Roblox has imposed a hard limit of 8 parallel threads. As such, this tool does not exactly measure your CPU’s core/thread count. Thanks to @Tomi1231 and @RuizuKun_Dev for pointing this out. However, this tool is still useful for finding a local limit lower than 8 on other types of devices, such as mobile ones.
Another disclaimer, it is also discovered that Parallel Luau does not work well on efficiency-oriented devices, which can include running on battery power and low-power CPUs. The results on these devices are surprisingly inconsistent.
Demo:
Live demo:
This is a pretty hacky workaround, but from my testing it seems to be pretty accurate and stable for the most part. All it does is run a test to measure the number of usable RBX Workers for parallelization in the task scheduler.
Why does this matter
On your PC there is a certain number of cores (or threads, the term is interchangeable in this post) that can be used for parallelization. You can divide up your workload in your code among these cores to accelerate computation time.
Let’s just say, you have 4 cores on your PC. Your workload can be divided up among 4 Actors, so that’s one Actor per core.

You can double up your number of Actors to 8, and it can still be equally divided among the cores. This time it’s 2 Actors per core. Each core finishes processing their Actors at around the same time and it all totals to 6 milliseconds needed for your parallel stuff.

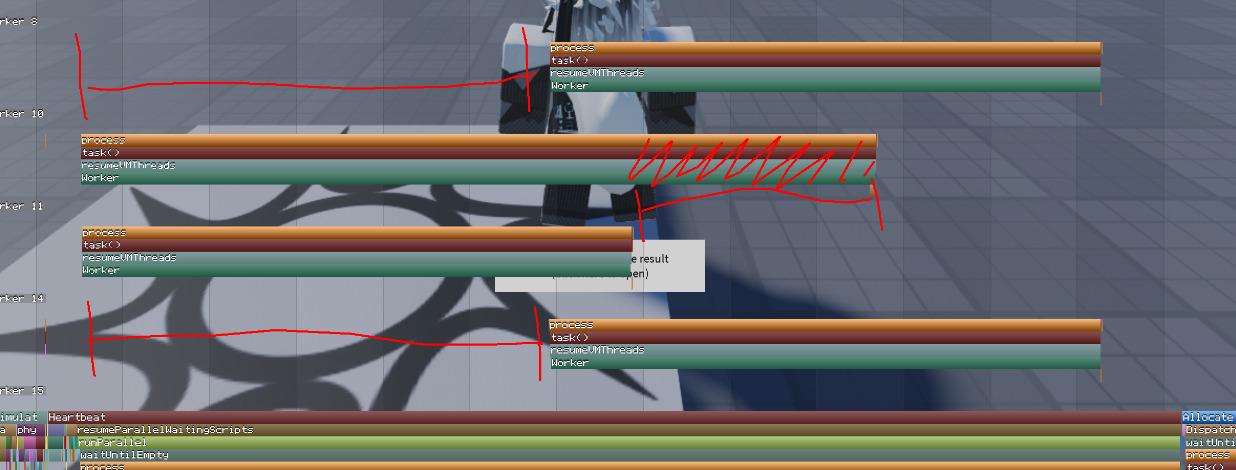
But what if you accidentally made one more Actor, totaling it to 9? The extra Actor randomly chooses one of the core to be worked on, and that chosen core needs more time to finish their extended assignment. But because the parallel resumption phase must wait for all cores to finish, it will extend it to 9 milliseconds!

This is a big problem for your game’s performance. The frametime gets bigger because of that one Actor holding back the parallel resumption phase. But this can be easily migitated by creating more and more Actors so that each of them gets smaller and individually takes less time. So, any extra Actors that didn’t fit won’t waste as much time and your performance loss gets smaller. In fact, this is the solution that Roblox wants you to use… with an unpleasant side effect that will be explained below.


As quoted above, this granularity has a problem. Each Actor is an instance that contains a script. If you have hundreds of these Actors, it can easily inflate your memory usage and also make it an absolute nightmare to manage.
Because parallelization is meant for mathematical workloads (it’s like the only thing it’s good at), you can imagine needing to do a lot of data transaction between your Actors and a central consolidation point. After all, you must know the result of your calculations! This means calling tons of BindableEvents, sending tons of Actor messages, and tons of SharedTable accesses. All of this adds to even more performance degradation, and eventually it can even become slower than just doing everything in serial. This phenomenon is called parallel slowdown and is something you need to watch out for.
Parallel slowdown is typically the result of a communications bottleneck. As more processor nodes are added, each processing node spends progressively more time doing communication than useful processing (Wikipedia).

So, the smart person would try to minimize the number of Actors they create. But they also want to make enough Actors to fully utilize the player’s CPU, without going past the limit. And so you have to measure and know their CPU core count beforehand to make the right amount of Actors, which is the goal of this tool.
How it works
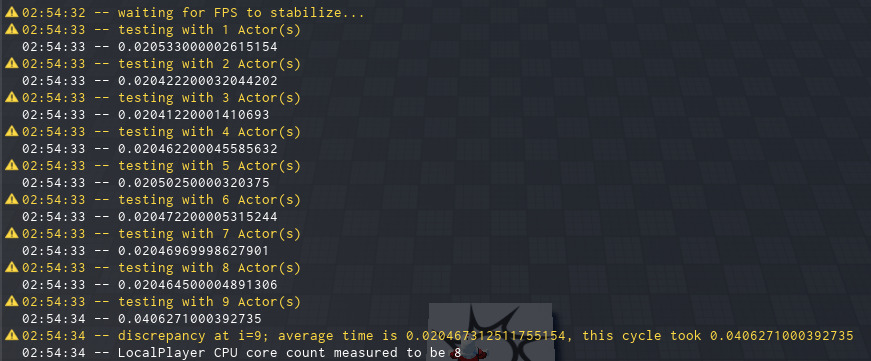
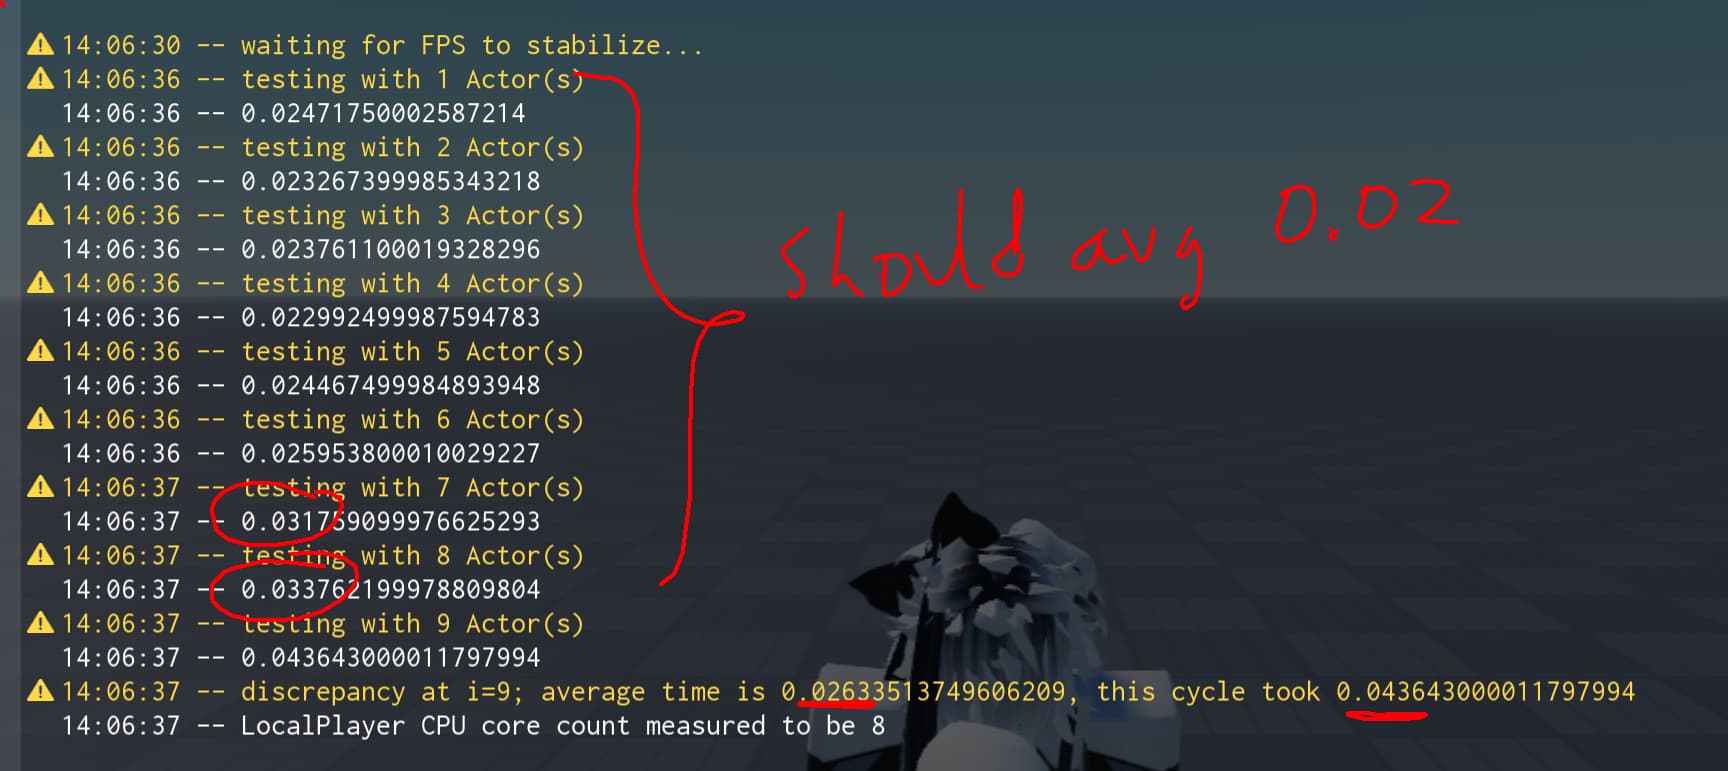
It’s pretty simple. Referring back to my explanation above, eventually you will create too much Actors and one of them will be an outlier that holds back everyone else. This can be used to find the “breaking point” by measuring the the duration of the parallel resumption phase. If it looks like the time has doubled after adding one more Actor, it’s more than likely you’ve reached the thread limit and the scheduler has to start stacking the Actors.

The attached rbxm file simplifies the entire process and outputs the calculated result as an attribute under workspace. I’ve also added the original demo so you can test it out immediately.
Note: The live place demo has a slightly different source code, but it is uncopylocked.
CPU core count finder.rbxm (4.0 KB)
measure CPU core count.rbxl (56.0 KB)

And the script themselves if you’re too lazy to open them:
Main script
local testLimit: number = 32 --number of test cycles; also the maximum limit of cores to be reported
local testDuration: number = 0.02 --yield time of each Actor script
local minimumIncrementFlag: number = testDuration * .75 --threshold for concluding the test
local stableFrametimeThreshold: number = 1/58 --see section below

local send = script:WaitForChild('Send')
local receive = script:WaitForChild('Receive')
local exActor = script:WaitForChild('ExampleActor')
type Worker = typeof(exActor)

do --wait for the framerate 2 b chill, because an unstable task schedule WILL ruin the test
	warn('waiting for FPS to stabilize...')
	local stableFramesCount: number = 0
	local connection: RBXScriptConnection connection = game:GetService('RunService').Heartbeat:Connect(function(dt: number)
		if dt <= stableFrametimeThreshold then --a frame is considered stable if the instantaneous FPS reaches the threshold
			stableFramesCount += 1
		end
	end)

	repeat task.wait() until stableFramesCount >= 60 --wait until you get 60 stable frames
end

local record: {number} = {}
local i: number = 0
while i < testLimit do i += 1

	do --create a new Actor for this next cycle of the test
		local ready: boolean
		receive.Event:Once(function()
			ready = true
		end)

		local new = exActor:Clone()
		new.Name = i
		new.Parent = script
		new:WaitForChild('Worker').Enabled = true

		while not ready do task.wait() end
	end

	warn(`testing with {i} Actor(s)`)
	local now: number = os.clock()
	local received: number = 0
	local breakOut: boolean
	local onRecieve: RBXScriptConnection onRecieve = receive.Event:Connect(function()
		received += 1

		if received == i then --at the conclusion of this test cycle
			onRecieve:Disconnect()
			onRecieve = nil

			local timeTaken: number = os.clock() - now
			print(timeTaken)

			local average: number = 0
			for _, v in record do average += v end
			average /= #record

			if math.abs(timeTaken - average) >= minimumIncrementFlag then
				warn(`discrepancy at i={i}; average time is {average}, this cycle took {timeTaken}`)
				breakOut = true
				return
			end
			table.insert(record, timeTaken)
		end
	end)
	send:Fire(testDuration)

	while received ~= i do task.wait() end
	if breakOut then
		print(`LocalPlayer CPU core count measured to be {i-1}`)
		break
	end

	task.wait()
end

workspace:SetAttribute('LocalplayerCPUCoreCount', i-1) --output
script.Parent:Destroy()
Actor script
local actor = script.Parent
local main = actor.Parent
local send = main:WaitForChild('Send')
local receive = main:WaitForChild('Receive')
local id: number = assert(tonumber(actor.Name), `Unable to format ID "{actor.Name}"`)

send.Event:ConnectParallel(function(testDuration: number)
	local goal: number = os.clock() + testDuration
	repeat until os.clock() >= goal --yield until the duration has passed
	receive:Fire()
end)

receive:Fire() --let the central script know that this Actor is ready