[Studio Beta] Introducing LibMP: the MicroProfiler API


Hello Creators,

You asked, and we delivered: introducing LibMP, our new MicroProfiler Luau API! The LibMP API is available to everyone as a Studio beta today. If you want early access to enable LibMP in your live games, see more details below.

This initial release provides a single, unified API for accessing comprehensive, fine-grained performance information. With LibMP, we’re exposing almost all the real-time performance data we have across game Client apps on all platforms, Servers, and Studio.

If you’re new to performance profiling on Roblox, check out our MicroProfiler documentation and tutorial video to learn more.

How to Use LibMP

LibMP is a Luau library that you simply add to your game. It has its own dedicated site where you can read the documentation, download the module, and find example scripts:

LibMP isn’t just for real-time data inside Roblox. You can use it to capture snapshots (dumps) and then analyze these captures outside of Roblox via Lute, an official runtime environment for Luau, similar to what Node.js is for the web.

What to Use LibMP For

The possibilities are vast, but a few key use cases include:

  • Custom Debug Widgets: Build your own in-game mini-profiler UI for testing and debugging.
  • Performance Analytics: Collect custom performance metrics directly from both clients and servers.
  • Client Snapshots: Capture performance data on the Client and send it to the Server for deeper analysis.
  • Server Alerts: Generate snapshots on your Servers and send them via HttpService to your external backend for analysis, allowing you to trigger alerts if performance drops.
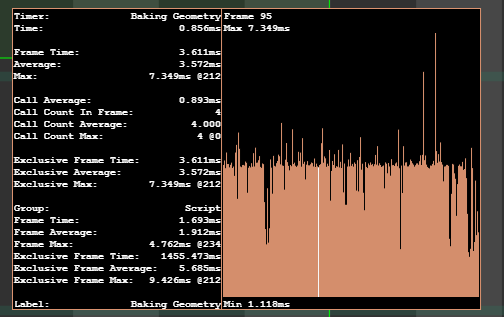
LibMP Demo

Check out the demo game to get an idea of what is now possible:

Spoiler Alert: You can now profile both your local Client AND your remote Server directly from your mobile phone using your own scripts!

image1

Rollout and How to Get Access

The LibMP API is accessible to everyone in Studio only, so you can start experimenting with the library immediately.

Want to use it in live Clients and Servers? While we plan to open access to everyone in the future, we’re currently rolling out live access by request. To enable LibMP in your live games, please complete our quick survey here.

We’ll try to grant access to everyone who requests. Our only ask is that you test LibMP thoroughly and share your feedback with us!

Important Note on Performance

Please be responsible when using this API in live environments. Enabling the MicroProfiler increases memory consumption. Once you have access, we advise enabling MP only for a reasonable percentage of game sessions, rather than your entire player base, to minimize overall performance impact. In the future, you’ll be able to customize data capture and buffer allocation to help minimize overhead while the MP is running, so you can enable it everywhere.

We’re going to be using LibMP extensively internally (keep an eye out for new releases!), and we’re incredibly excited to see how you leverage it to profile and optimize your games.

Happy building,

ZenMa1n

130 Likes

This topic was automatically opened after 10 minutes.

Is this for Version 726 or 727?

Important question because it is putting me in 726. :thinking:
I am not sure if it puts others there as well, but like yesterday it was fine.

And not because of zluauscatterhash who is still stuck on version 726.


So what will happen to the .html files.

3 Likes

could this be requireable via require("@rbx/LibMP")?

10 Likes

Does this enable memory tracking if forced on by LibMP.Control:EnableProfiler(true) ?

This will allow our devs not to have to go through the process of:

  1. Opening the game
  2. Turning on the micro-profiler on the mobile device
  3. Leaving the game
  4. Killing the Roblox client app
  5. Starting the Roblox client app
  6. Joining the game
  7. Begin profiling

Being able to enable the profiler to trigger memory tracking would be valuable as that’d collapse all the steps and reduce the process overhead. This would save a ton of wasted time.

4 Likes

Okay but that place thumbnail is sick.

Anyway, can’t wait to have access to this in live servers! My home network doesn’t let me view the mobile microprofiler for whatever reason, so it would be neat to make a dev-only way to access this on mobile for my game.

3 Likes

Awesome to see what seems like Spider for WASM to Luau - any chance Roblox might release the original source code for this? I’m skimming through to understand it more, but it’s kind of impossible in a lot of places.

I also second @rbx/libmp if it gives opportunity to avoid freezes and potential crashes with script analysis enabled.

2 Likes

This should work fine in v726!

So what will happen to the .html files.

They’ll continue to work as usual, and at the same time I’ll be unifying the internal formats, so they’ll also be readable via LibMP.

1 Like

could this be requireable via require(“@rbx/LibMP”)?

At the moment, no. We had some internal discussions about it, and it was decided that these @rbx shortcuts are reserved for special use cases only. For use in actual games, you’ll still need to add it manually.

1 Like

Now this is actually pretty darn awesome.

… But you know what isnt awesome? The fact that the microprofiler stopped showing core assignments and frequencies!


I hope this is just a bug because god i need that else all profiling on mobile is entirely worthless. Is it running on a big core or a small core? Is it running at 4 ghz or 500 mhz? I dont know!!!

Also the microprofilers font on studio gives out entirely after a couple play tests. Roblox please fix… :folded_hands: :folded_hands: :folded_hands:

2 Likes

The logic remains the same here, you simply enable MP programmatically.

When the memory counters were refactored to be disabled by default (it’s a long story), they were designed so that they can only be re-enabled when the application starts. The reason is that if you enable memory tracking at an arbitrary point in time, you don’t have a baseline showing what each piece of allocated memory corresponds to.

As a result, if memory tracking is enabled mid-run and some memory is later freed, the counters could end up showing negative values.

There’s an ongoing effort to develop a new always-on memory tracking system with lower performance overhead, but that’s another long story.

2 Likes

So what was the original language this was written in?

I don’t think a real person went in and created variable L9

or

Code
local L3pw, L3px, L3py, L3pz, L3q0, L3q1, L3q2, L3q3, L3q4, L3q5, L3q6, L3q7, L3q8, L3q9, L3qA, L3qB, L3qC, L3qD, L3qE, L3qF, L3qG, L3qH, L3qI, L3qJ, L3qK, L3qL, L3qM, L3qN, L3qO, L3qP, L3qQ, L3qR, L3qS, L3qT, L3qU, L3qV, L3qW, L3qX, L3qY, L3qZ, L3qa, L3qb, L3qc, L3qd, L3qe, L3qf, L3qg, L3qh, L3qi, L3qj, L3qk, L3ql, L3qm, L3qn, L3qo, L3qp, L3qq, L3qr, L3qs, L3qt, L3qu, L3qv, L3qw, L3qx, L3qy, L3qz, L3r0, L3r1, L3r2, L3r3, L3r4, L3r5, L3r6, L3r7, L3r8, L3r9, L3rA, L3rB, L3rC, L3rD, L3rE, L3rF, L3rG, L3rH, L3rI, L3rJ, L3rK, L3rL, L3rM, L3rN, L3rO, L3rP, L3rQ, L3rR, L3rS, L3rT, L3rU, L3rV, L3rW, L3rX, L3rY, L3rZ, L3ra, L3rb, L3rc, L3rd, L3re, L3rf, L3rg, L3rh, L3ri, L3rj, L3rk, L3rl, L3rm, L3rn, L3ro, L3rp, L3rq, L3rr, L3rs, L3rt, L3ru, L3rv, L3rw, L3rx, L3ry, L3rz, L3s0, L3s1, L3s2, L3s3, L3s4, L3s5, L3s6, L3s7, L3s8, L3s9, L3sA, L3sB, L3sC, L3sD, L3sE, L3sF, L3sG, L3sH, L3sI, L3sJ, L3sK, L3sL, L3sM, L3sN, L3sO, L3sP, L3sQ, L3sR, L3sS, L3sT, L3sU, L3sV, L3sW, L3sX, L3sY, L3sZ, L3sa, L3sb, L3sc, L3sd, L3se, L3sf, L3sg, L3sh, L3si, L3sj, L3sk, L3sl, L3sm, L3sn, L3so, L3sp, L3sq, L3sr, L3ss, L3st, L3su, L3sv, L3sw, L3sx, L3sy, L3sz, L3t0, L3t1, L3t2, L3t3, L3t4, L3t5
5 Likes

Spider

Nice find! I like Spider a lot - it’s a wonderful tool, and it is indeed used here. WASM-to-Luau is a very powerful approach when you want to maintain a single codebase that runs across different environments and languages.

any chance Roblox might release the original source code for this?

Yes! I’ve been developing it with open-sourcing in mind, I just need to hypnotize a couple of people to make it happen. :laughing:

8 Likes

So what was the original language this was written in?

It’s written in C++ and exposes a C-style API to make this WASM-based approach work.

3 Likes

Pretty interesting approach. I was expecting a full pure Luau implementation but this is cool to see as well.

2 Likes

the microprofiler stopped showing core assignments and frequencies!

I remember that the last time this addon caused a regression on macOS, we did some refactoring, and it’s possible we haven’t re-enabled it yet. I’ll double-check - thanks for reporting it! It’s also good to know that this feature is really useful.

font on studio gives out entirely after a couple play tests

Yeah, and I’ve noticed that this happens not only with MP font textures, but with other objects as well. I’ll talk to our rendering team.

2 Likes

Yes thank you thank you! A smaller issue i have experienced with the profiler for a bit of time is that it tends to swap labels around like this.
image
It’s not a big deal to be fair since i know what it actually is (and i imagine most developers who properly label their code will also know what it is actually supposed to be) but still. It’s a little janky.

1 Like

Will MicroProfilerService ever be properly documented? The compiled system seems to be using it, and I would like it if it was documented so folks can make a pure Luau implementation if they wish in their libraries.

1 Like

Yeah, pure Luau would be better for… Luau. But we work with MP data in C++ (in the engine), in Luau (in scripts), and in JavaScript (in the HTML dump viewer). Our engineers also frequently write small Python scripts to extract information from dumps.

On top of that, our analytics infrastructure uses C# and Go, and those teams would like to parse dumps as well. So the crazy, and previously untested, idea was to write a single implementation in C++ and make it work (via magic) as a native library for all of those languages. That way, whenever you fix something, the change automatically propagates everywhere.

6 Likes

Hmm. JavaScript is understandable when it comes to working with HTML files, but Python did surprise me. Why not a common Lute API written in pure Luau that engineers can run if they wish to access MP? Why use python?

Personally, a simple Lute script that accepts a dump file location as an argument and prints results would be the most sensical, this seems overly complex from a distance. I wouldn’t be that upset as WASM is really powerful and I advocate for it, but this doesn’t seem… fitting for WASM.

1 Like