Total Server Memory Value remains the same despite PhysicsParts going down

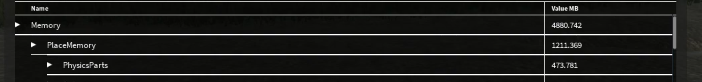
When clearing part(s), the PhysicsParts memory subvalue goes down, but the Total Server Memory Usage value remains the same.

In the video below, at the VERY beginning, you can see PhysicsParts was hovering around 1059 MB. When I cleared my workspace, it went down to 473 MB. It went down, as it should. HOWEVER, the total memory value (the very top value) remained the same, as if it didn’t recognize the change within the PhysicsParts memory value-- it was frozen.

BEFORE
image

AFTER
image

Expected behavior

In a perfect world, the total server memory value should have went down by the difference of the changed PhysicsParts value (around 600 MB, since PhysicsParts memory subvalue went from 1059 MB to 473 MB). It should have been around 4200 MB instead of 4800 MB.

6 Likes

Assigned to someone at Roblox - we’ll get back to you!

2 Likes

Hello! Apologies for the late reply.

Is this issue still happening? If so, can you please check whether the memory is recategorized under another category, such as Untracked Memory?

I suspect that the memory has been freed, but that we have cached the freed memory to reuse for another allocation later. This behavior is very common in memory allocation as it allows the allocator to avoid executing an excessive number of system calls, and therefore makes the memory allocator faster overall. If this is occurring, the memory would most likely be recategorized as “Untracked Memory”. We plan to improve memory categorization in the future to make situations like this more clear.

Thanks!