I’ve been doing a great deal of cleanup on some old systems of mine and I’ve encountered something strange. In the microprofiler, equally spaced “heartbeats” of frametime spikes have made the gameplay a tad bit jittery.
![]()
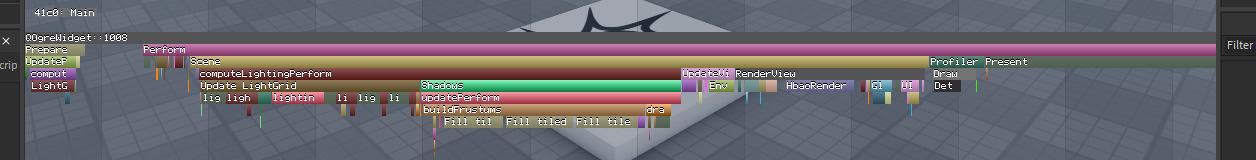
Inspecting the source of this issue results in the following tags, which are marked under a category I’ve never personally seen before, $Event:

RibbonMainWindow: :77 and qt_scrollarea_viewport: :12 are the tags in question causing 33ms of extra lag. QOgreWidget: :1008 and 1 : : are tags present during every frame and seem to encompass the usual processes. All of these tags fall into the “Qt” tag group as well.
Upon further inspection of these tags leads us to the following links:
https://www.devmachines.com/documentation/QtitanComponents/html/ribbonmainwindow.html
https://doc.qt.io/qt-6/qscrollarea.html
These are obviously off-platform documentation websites, with both seemingly referencing products made by the Qt Group. Qt is a GUI making software. I can’t find anything directly stating Roblox uses Qt anywhere, but it’s not unordinary. Despite the benign nature, a GUI backend process causing 33ms frametime spikes seems odd, and with a distinct lack of any documentation on Roblox’s end as to what’s going on here, I can’t really stop this issue.
Furthermore, seeing QOgreWidget piqued my interest, considering that Ogre3D is a rendering engine that hasn’t been used in Roblox for nearly a decade. QOgreWidget in particular is a widget that embeds Ogre3D into Qt, and according to the documentation, only runs on Linux and Windows 7 (my machine is neither). Despite these oddities, it makes sense to see the rendering processes fall under it if Roblox was using QOgreWidget to embed Ogre3D into the Roblox application (?).
These confusing tags have suddenly popped up alongside a number of more minor and less confusing microprofiler changes. I have no clue what the $Event timer is, why it only includes tags under the group “Qt”, and why they are causing gargantuan lag spikes in my game. There’s an even more confusing lack of documentation on any of these in relation to Roblox’s usecase. I’m completely unfamiliar with Qt and Ogre3D, and so I don’t really know how I should handle this situation, and how it should change my current understanding of Roblox’s engine and render pipeline. If there’s anyone with more knowledge on any of this please help me diagnose the issue here.
TL;DR: Third party backend apps are creating microprofiler tags that describe processes seemingly taking up 30 or so milliseconds of frametime. There is no Roblox documentation on any of this.