Analytics: New User First Session Retention & New and Returning Users

Hi creators,

Today, we’re making two updates to our Engagement page to help you take action to engage and retain your users:

  1. New user first session retention
  2. New and returning users and session time

New User First Session Retention


Data shown is illustrative

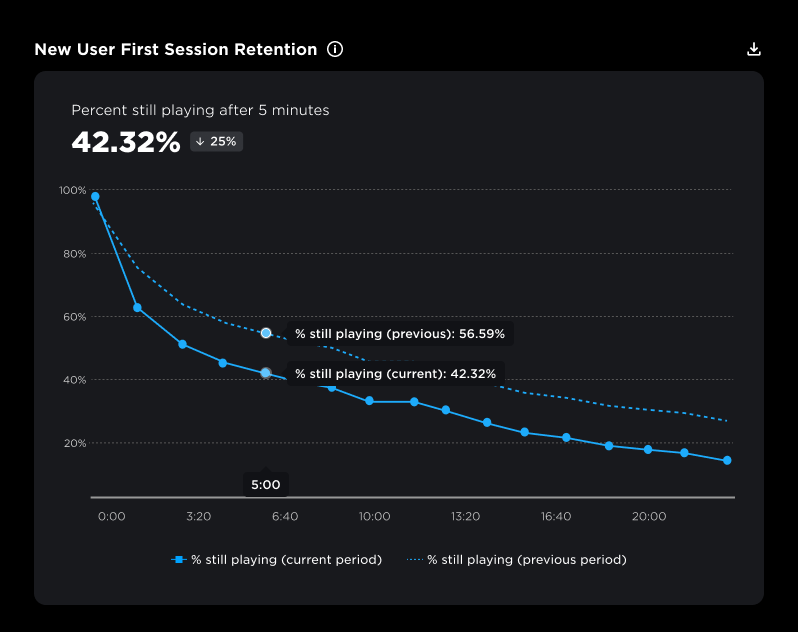
This chart shows how many new users are still playing X minutes after joining your experience for the first time. It compares the current period with the previous period.

For example, here’s how you can take action based on the chart above:

The percent of new users still playing after 5 minutes declined from 56% to 42% week over week.

  • With this insight, you could explore multiple causes for this drop

    • You could look into new user onboarding friction from a recent update.

    • You could look at error and performance reports to see if there has been any change in the performance and stability of your experience after a recent update.

New and Returning Users and Session Time


Data shown is illustrative

These charts let you track changes in new and returning users and session time.

For example, here’s how you can take action based on the charts above:

The data show that new user metrics went up but returning user metrics went down.

  • With this insight, you might consider whether a recent update resonated with new users but alienated your returning user base.

You can also compare these charts with how you’re acquiring new and returning users on your acquisition analytics page.

What’s next

Per our creator roadmap, we’re also working on features to help you:

  1. Track in-game economy and funnel events via a new SDK.

  2. Understand the value of users you’re acquiring by Roblox and external source.

Stay tuned for the above in the coming months. Please let us know if you have any questions or feedback in the comments. Thank you!

98 Likes

This topic was automatically opened after 10 minutes.

It’d be great if we had benchmarks shown for the new versus returning user session length. Good update!

12 Likes

Very interested about this, I hope that things go as expected.

The current upgrades to the game analytics have been really helpful to a number of projects for me and my team! Thanks a lot :sparkles:

5 Likes

Really cool to see things moving away from averages!

Will we be able to customize the “previous” period that’s used in the “New User First Session Retention” chart?

I notice you mention week over week here, but I could easily see cases of rapid iteration where we might need something more frequent.

2 Likes

Yes you can set whatever date period you want on engagement page - go check it out :slightly_smiling_face:

1 Like

This is going to be great for informed promotion strategies. I also bet a lot of devs would love to see specifically which sites/pages users are coming from. (e.g. YouTube, TikTok, etc)

7 Likes

So just to clarify, the “previous” and “current” lines are just the bounds of the date range’s data?

e.g.

Date Range: 01/01/2024 - 03/01/2024
Would be 01/01/2024 vs 03/01/2024 ?

2 Likes

We still haven’t a way to see the visits history of an experience, and we are unable to view analytics beyond 90 days, which is far too short of a timeframe for any experience that isn’t already doing so well it hasn’t to worry about analytics.

1 Like

Not quite - it compares the current period with the previous period. Example:

Current period: 2/25 - 3/26
Previous period: 1/25 - 2/24

If you hover over the % change on any chart you can see the date ranges:
image

4 Likes

For the Analytics section, you can set a custom date up to 1 year in the past using the Date Picker > Custom:

and the chart will show a full year worth of analytics:

1 Like

I would like to still be able to see the hourly and monthly visits. This has been the reason why I miss the old developer stats a lot. It gave an easy way to show how many players played during a certain month.

2 Likes

Anyone willing to share what this chart looks like for a successful game? Here is what one looks like for a game I’m doing early testing of

1 Like

Very interesting - what game is this? Feel free to DM me.

1 Like

this will be useful for me. thanks

This is misleading. I think it would be better if they were using the same scale.

1 Like

is support for AB testing updates or feature flags planned?

2 Likes

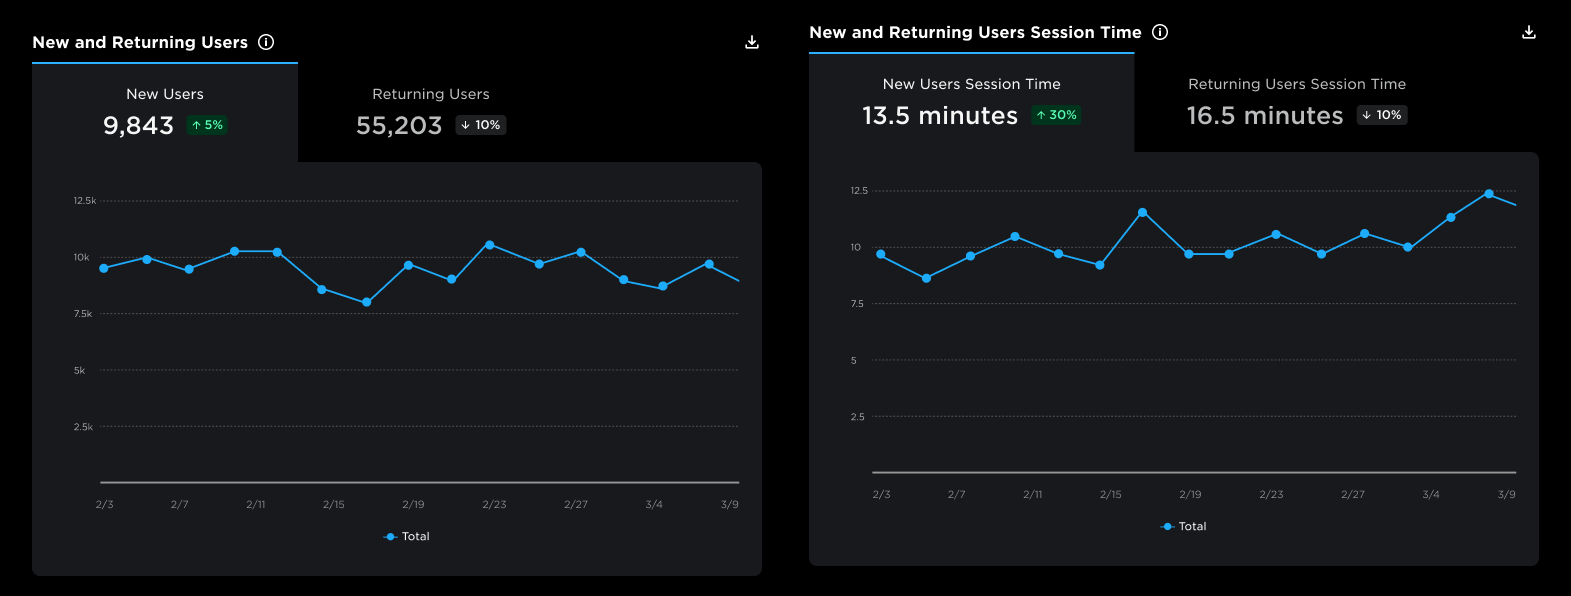
We thought about that, but decided to let the scale change because New Users behave very differently from Returning Users

It’s normal for some Experiences to have a much shorter session time for New Users than Returning Users.

If that’s the case any changes to your New User line won’t be discernable on the chart

Example
Imagine new user=4min avg and returning =20min average

If New Users adds or reduces 30s, you won’t notice at a glance if the scale stays the same, but it might be a very big impact on whether those new users will come back the next day and a leading indicator that your D1 Retention is about to change

4 Likes

We have monthly active users in our engagement for you to see monthly data. It is rolling 30 days.
For hourly, we have the performance page that is more realtime to give you CCU value, we are planning to add total visits for realtime as well.

2 Likes

BOOGA BOOGA [REBORN]

image

1 Like