Today, we are excited to launch a new Performance page that lets you view up-to-the-minute data on concurrent users, session time, server frame rate, and server memory usage.
Monitor your experience’s performance before and after each update
To view your Performance page:
Navigate to your Creations page and select your experience.
Select Performance.
This page is available to experiences with 100+ daily active users (we don’t remove access once granted). It shows you up-to-the-minute data on the following metrics:
Metric
Description
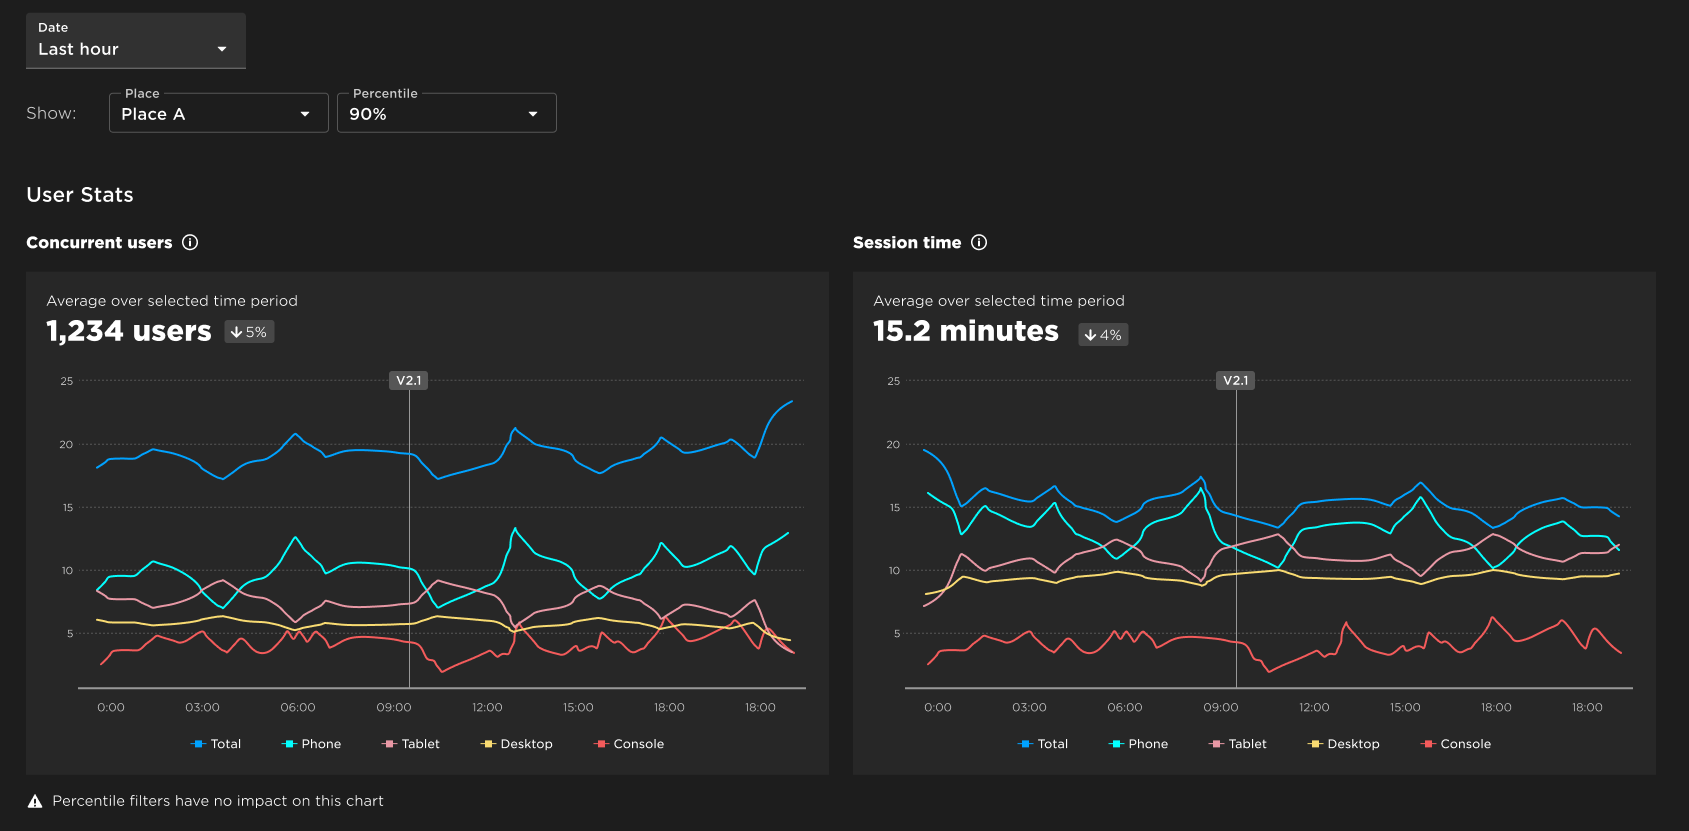
Concurrent users
Number of users in your experience at any given time.
Session time
Length of time users spend in your experience per session.
Server frame rate
Frames per second processed by the server.
Server memory usage
Memory consumed by the server.
We recommend monitoring this page before and after updating your experience to find performance issues early. You can also track your recent updates using the version annotations on each chart (you may need to select a longer date range to see the annotations).
We have more exciting analytics updates coming soon, including crash rates and error reports. To get an early preview, fill out this quick form to join our creator analytics community.
Thanks and leave a note below if you have any questions or comments.
Why is this feature only limited to games/people with more than a thousand users at a time on a game? I have a niche community that tries pushing boundaries that this feature would be completely useful for!
Hi
Really cool, but I was wondering if there could be a reference for the ‘Server memory usage’ statistic.
It’s now pretty easy to see issues with the game, but I think it would also be good if we could compare our game’s memory usage to a baseline of similar experiences. Our server memory usage seems high, but without references we can’t really tell if it’s too high.
Maybe something similar to the ‘50th-90th’ percentile charts in the engagement, retention, etc tabs.
Really excited to use this feature next time we update! One issue I am seeing now is that the place filter option does not appear to be updating. This may be due to the large amount of places under our experience.
I own a place that’s not under a group. Really wish fellow collaborators can access this info as I focus on programming the game while others work more on performance monitoring + feature planning. Is there any way or plan in the works to get collaborators to view pages like these?
Also, how does the percentile metric affect “Average over selected time period”? Seems odd to have average and use percentiles in same query. Unless this is referring to average of the percentile over some interval.
Is this a memory leak…?
The memory going up overtime cant be good right? But also this place is 30 players max, so maybe its just more players joining?
Also also, slight readability thing: maybe the text on top of the graph should say megabytes instead of gigabytes if its under 1gb? It would be easier to read
This is such a great change. We use Game Analytics to track performance (place memory, ping, etc.) and an update broke a part of the SDK related to sending data. We thought that performance the data is lost but Roblox came in a clutch .
One thing that’d be awesome to see at some point is both more granular breakdown for days (14 days, 60 days, etc.) as well as custom dates. Suuuuuuper excited to see such a great access to place stats for devs!
Is the concurrent count correct? I know for sure I have seen a 20% higher CCU count on our game than this dashboard displays. Can cross reference with RoMonitor stats and confirm this as well.