Introducing Studio Visualization Modes

[Update] August 20, 2024


[Update] August 15, 2024


Hey Creators,

Today, we’re adding visualization modes to Roblox Studio. This means you’ll be able to quickly toggle various debug modes and visualizations in Studio to speed up and augment your workflow, such as quickly visualizing collision fidelity or adjusting your camera speed to travel long distances quickly. Previously, these visualizations were hidden in the settings menu.

VisualizationModes always appear at the top-right corner of the viewport

We’re giving several engine features some love with this new integration, and this is just the start.

Below is the list of the currently available visualization modes and how they can help you build:

  1. GUI - Accelerate your GUI workflow

    • GUI overlay: This is StarterGui.ShowDevelopmentGui repackaged into a toggle that lets you show/hide the GUIs your teammates are working on, so you can build free of distraction.
  2. Pathfinding - Accelerate your usage of PathfindingService

Tip: Remember, pathfinding is not the same as path following - the navigation mesh and pathfinding service is a powerful tool for creators on Roblox to find paths through dynamic maps

  • Pathfinding modifiers: Turns on visualizing PathfinderModifier while the navigation mesh is on, used to represent space that has a higher or lower cost to be traversed; annotating your map with pathfinding modifiers can allow for more powerful and correct traversal.

  1. Physics labels - Accelerate your debugging and understanding of how the physics engine operates.

    • Anchored parts: Indicates when objects are anchored for fast debugging of your physics mechanisms

    • Assemblies: Highlights assemblies, which are physical groups that are guaranteed to stream in together and simulate together

    • Awake parts: Displays highlights on objects that are currently being simulated by the physics engine

    • Network owners: Allows you to see colored outlines around objects to indicate their client/server ownership, helping you understand where ownership lies for physically simulated objects

    • Mechanisms: Visualizes each mechanical and mover mechanism as a unique color, making it easier to see and understand how the parts are interacting with each other. This can be especially helpful when building complex physics simulations or mechanisms.

  2. Physics simulation - Understand the physical simulation underlying Roblox

    • Collision fidelity: Ever wanted to optimize your physical simulation, or get a more precise collision simulation? Specify the collision fidelity of your parts to truly see what is colliding with what.

If you’ve got a massive place file with a lot of unique meshes, understanding and controlling physical fidelity can help you manage memory usage.

  1. View

    • Camera Speed: controls how fast your camera moves around using WASD in the 3D viewport

Shortcuts

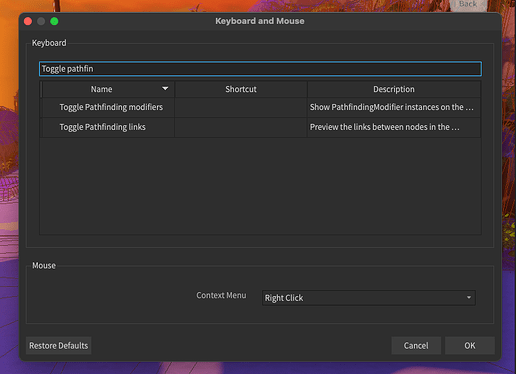
Any good productivity tool should come with shortcuts, and visualization modes are no exception. You can add shortcuts to any of these toggles, and add them to your “Quick access” bar.

You can find this by going to settings > edit shortcut keys

These are also readily available in the “Quick Open” menu:

The quick open menu can be found by pressing Ctrl + P in Studio!

Getting access

Try it today by updating Roblox Studio. We plan to add more visualization modes to this menu and release new ones as necessary to support your workflows. What visualizations would you like to see in this menu? Let us know below, and send feedback our way!

FAQ

Click here to view the FAQ!

Why did you do this?

  • We believe that powerful visualization tools are the secret to accelerating your workflow. They help turn complex concepts into simple ones, and now that they’re at your fingertips they’re much easier to use.

Can I add my own visualization modes?

  • Not yet – but we hope to enable this in the future!

Can I have more than one mode enabled at once?

  • Yes. Most visualization modes will work with other modes. However, some modes toggled on at the same time may result in information overflow, limiting their usefulness.

Can you add back in the “Device emulator” button?

  • Yes, we plan to add a visualization mode for “Device emulation” in the future and will update you once we do.

How do categories work?

  • Categories are assigned to each mode and visualization modes are sorted alphabetically within the menu.

Can I use these visualization modes during runtime?

  • No. Right now, we don’t support plugins running in experience.

Will the location and rendering around visualization modes change?

  • Yes. With future Studio releases we may move the location, look, feel, and more of visualization modes.
359 Likes

This topic was automatically opened after 10 minutes.

This is very cool imo, I like it!

27 Likes

image

hmm the lines

image

hmmm

FFlagStudioVisualizationModes9 toggles this feature btw.


I like the idea though. I recently asked my self if there would be less buttons to click just to change some of the visualization things. And here is the update! :thinking:

But the way the buttons get added recently…

20 Likes

Thanks! I could have sworn I had that border aligned when I wrote the code initially but I guess it got misaligned at some point. We’ll hopefully get a fix out soon.

21 Likes

HYPE HYPE HYPE HYPE HYPE HYPE HYPE HYPE HYPE HYPE HYPE HYPE HYPE HYPE HYPE HYPE HYPE HYPE HYPE HYPE HYPE HYPE HYPE HYPE HYPE HYPE HYPE HYPE HYPE HYPE HYPE HYPE HYPE HYPE HYPE HYPE HYPE HYPE HYPE HYPE HYPE HYPE HYPE HYPE HYPE HYPE HYPE HYPE HYPE HYPE HYPE HYPE HYPE HYPE HYPE HYPE HYPE HYPE HYPE HYPE HYPE HYPE HYPE HYPE HYPE HYPE HYPE HYPE HYPE HYPE HYPE HYPE HYPE HYPE HYPE HYPE HYPE HYPE HYPE HYPE HYPE HYPE HYPE HYPE HYPE

You might have noticed that I am extremely hyped for this!

90 Likes

Anchored parts with bloom/without

image
image

20 Likes

The example place for this reminds of this game by Alpha Strike Group: Pirate Island (UPDATE) - Roblox

8 Likes

This is interesting – I always thought that toggling the ShowDevelopmentGui property would disable it for all studio members. Does setting this property only replicate it to your own studio client?

10 Likes

Guys he might be hyped for this

14 Likes

HYPED!!! LETS GO!!! HYPE HYPE HYPE HYPE HYPE! HYPEEEEEE!!!

I am hyped.

31 Likes

This is definitely a much more user-friendly method than has previously existed to use these functions in Roblox Studio. I’m especially glad to see a collision fidelity view that doesn’t accidentally get inherited by all new studio windows opened - a welcome improvement indeed.

However, given some recent experimentation I’ve been doing, I can’t help but wonder - are there plans to use this framework to allow for an expansion of the available tooling for scene inspection natively available for the Engine?


Over the past day or so, I’ve been working on a major optimization pass for SCI - Pathos-III, using external DirectX frame analysis and profiling tools in order to be able to visualize several things - ranging from

Viewing the effects of atmosphere,

Pictured Below: The effect applied by Atmosphere, allowing for utilization of it to hide geometry culling.

To viewing geometry normals,

Pictured Above: The geometry normals used to display materials in a rendered environment - allowing for it to be visible directly what specifically is potentially able to be replaced or removed without a major visible impact from afar.

To viewing the actual geometry being rendered every frame.

Screenshot 2024-08-13 144832

Pictured Above: A wireframe of some geometry that I was unaware was being rendered from a certain location, allowing for me to identify what still needs to be set up to handle streaming in a more effective manner.

In addition to these, this has allowed for me to view the actual per-asset memory consumption of textures (and view mipmaps), allowing for me to focus my optimization efforts where they will have the greatest impact, and allowing for me to benchmark these frames to be able to understand the rendering performance impact of changes.

Unfortunately, as I am aware, such tooling is quite complex, and likely both outside of what is reasonable for most developers’ needs in addition to requiring a significant degree of implementation work to make usable by the average developer.

That being said, are there any plans to implement any such functionalities as are possible via static frame analysis/profiling into Studio itself using this system?

29 Likes

Pretty handy stuff!
I wonder if we will be able to customize the list in the future. For example what if you could specifically add what GUI you want to quickly disable and enable rather than only being able to disable/enable all UI.

Also where’s wireframe view? :frowning:

10 Likes

image
Dawg what happened

25 Likes

image
Gosh, I’m really sorry. There is an extra 2 pixels worth of padding on the right of the search bar.


Other than that, great feature–I’ve always hated navigating to Studio Settings or using a 3rd party plugin to toggle Collision Fidelity.
Thanks for simplifying the process!!

21 Likes

I am in love with the amount of updates we’ve seen to Roblox studio lately, keep up the great work.

11 Likes

Hey. Do you have any information about Editable Mesh feature. It will be able on client soon?

10 Likes

Ooooh!!! QOL update! AND IT’S VERY GOOD!!!

I LOVE QOL updates, ESPECIALLY ONES LIKE THESE! Good work whoever was behind this!

8 Likes

beautiful!!!
roblox taking good care of us developers

9 Likes

this is incredible, good addition!

7 Likes